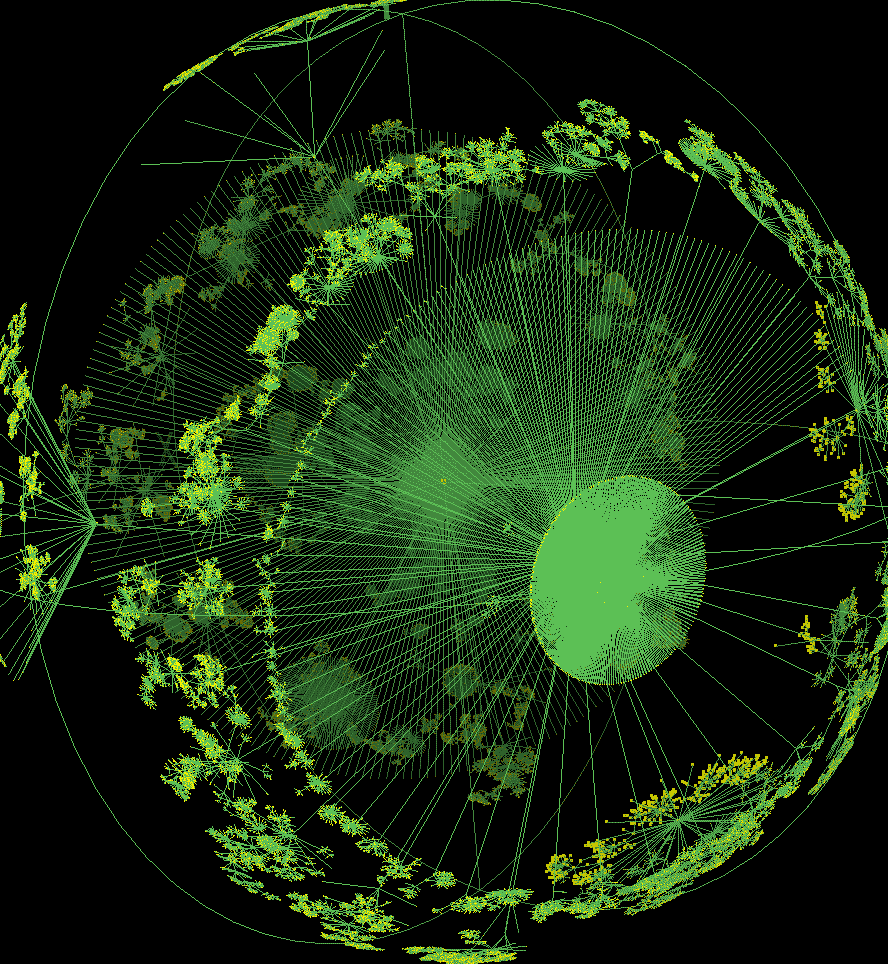

These striking images are 3D hyperbolic graphs of Internet topology. They are created using the Walrus visualisation tool developed by Young Hyun at the Cooperative Association for Internet Data Analysis (CAIDA).
http://www.caida.org/tools/visualization/walrus/